Historically speaking, shipping volumes at U.S. ports generally increased steadily on an annual basis due to population growth and, in turn, increased consumption, with the occasional ebb or flow due to extreme economic expansionary or recessionary periods. Even then, the level of cargo growth generally stabilized over a longer period, continuing an upward trend, especially as e-commerce matured and became a bigger part of our lives.
That all changed as a result of the COVID-19 pandemic.
The period between 2019 and 2022 saw global economic shutdowns, increased working and shopping from home, sporadic geographic reopenings, retail inventory overload, supply chain chaos, and more, all of which affected the timing and amount of goods that come and go from global ports. Therefore, while in the past it was good enough to measure cargo volumes year-over-year, this time we need to evaluate the changes between pre-pandemic 2019, pandemic-ridden 2020, the reopening in 2021 and the closer return to normalcy of 2022.
.jpg)
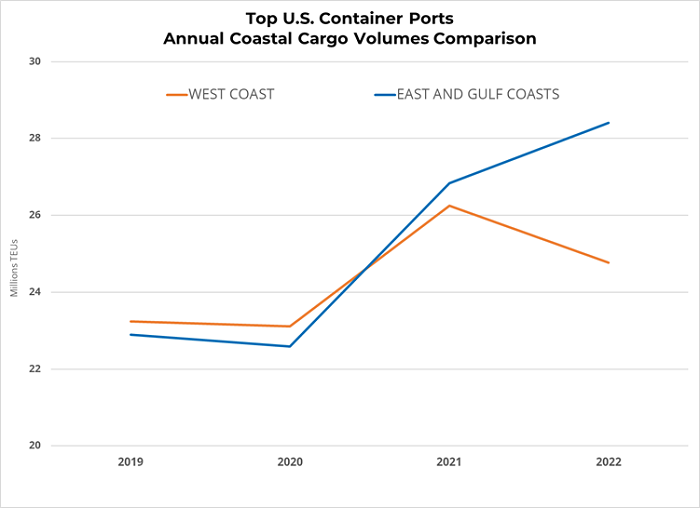
Total container volume for the top 10 studied ports in 2022 edged out 2021 totals, was 16.4% higher than 2020, and grew by 15.3% when comparing to 2019. As anticipated, an increased amount of cargo was shifted to entry points on the East and Gulf Coasts, especially during the second half of 2022. As a result, those ports posted growth while West Coast ports endured losses. In fact, the East and Gulf Coast handled nearly 54% of the U.S. trade in 2022, a notable change from the previous three years when the split was essentially 50-50.
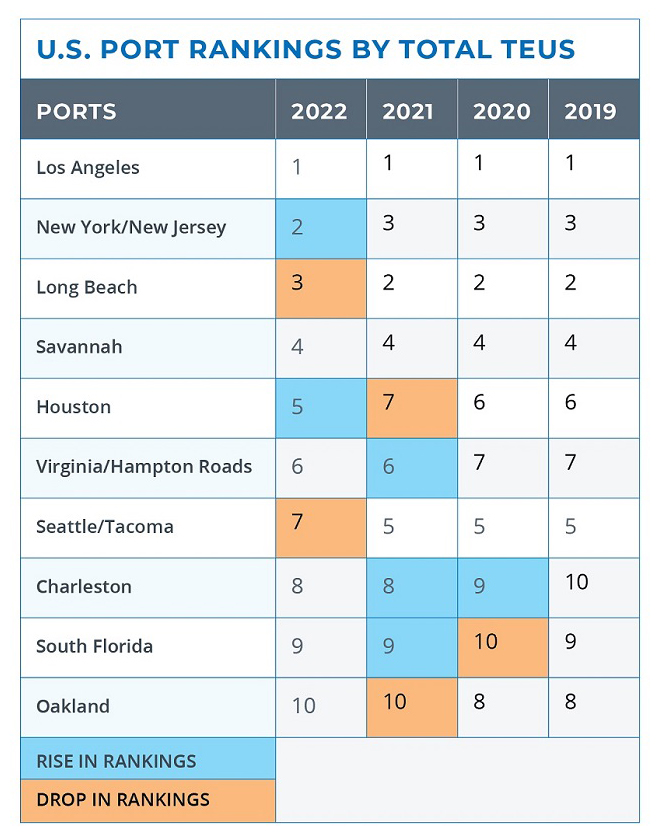
When comparing 2022 to pandemic-ridden 2020, nine of the 10 ports recorded growth (Oakland being the exception), seven with double-digit percentage increases. When comparing to the pre-pandemic level in 2019, eight of the 10 ports had higher container volumes in 2022 – six with a double-digit rise in TEUs (twenty-foot equivalent units).
STATISTICS BY 2022 PORT RANKINGS
| 1 |
After breaking its record for cargo in 2021 while surpassing 10 million TEUs for the first time, the Port of Los Angeles experienced a 7.2% drop in cargo volume in 2022. However, it still outperformed 2020 and 2019 totals and held its place at the top of the rankings throughout the four-year period. |
| 2 | The Port of New York/New Jersey broke its high for container volume for the sixth consecutive year in 2022, outpacing 2021 totals by 5.7%. In the process, the East Coast’s largest port moved the most cargo in the U.S. in August, and then again in September, outperforming the largest ports on the West Coast. The record-setting volume for 2022 also represents more than 25% growth over both 2020 and 2019 totals and moved the Port of New York/New Jersey to No. 2 in the rankings, surpassing the Port of Long Beach. |
| 3 |
The Port of Long Beach suffered a slight cargo loss in 2022, but still recorded double-digit percentage growth over both 2020 and 2019. Its 19.7% increase over pre-pandemic totals is by far the highest among its West Coast counterparts. |
|
4 |
The Port of Savannah, the fastest growing port on the East Coast, broke its calendar-year record for the sixth consecutive time in 2022 while experiencing a 5% increase in cargo, strengthening its place as the fourth busiest U.S. port. Total container volume approached 6 million TEUs, over 25% higher than both 2020 and 2019 and nearly double the level of just 10 years ago. |
| 5 |
The Port of Houston, the fastest growing port in the U.S., recorded double-digit percentage growth when comparing 2022 to each of the past three years. It is the only top 10 port to accomplish that feat, posting more than 30% increases in cargo vs. both 2020 and 2019. Houston was also the only port to record a double-digit increase in 2023. As a result, the Gulf Coast city jumped from No. 7 to No. 5 in port rankings, registering nearly 4 million TEUs in 2022, just two years after surpassing 3 million units. |
| 6 | The Port of Virginia broke its record high for cargo for the second-straight year in 2022, recording 5.1% growth over 2021. It is one of two ports that recorded more than 30% growth over its 2020 total, and volumes were 26% higher than 2019 pre-pandemic levels. Port of Virginia remained in 6th in the overall rankings as it climbed ahead of Port Seattle/Tacoma but was surpassed by Port Houston. |
| 7 | After rebounding in 2021 following a substantial drop during 2020, the Port of Seattle/Tacoma recorded a 9.4% decrease in container volume in 2022. The loss essentially returned cargo volume back to 2020 levels, dropping the northwest port to No. 7 in the ranking. |
| 8 | The Port of Charleston broke its record high for cargo for the second-straight year in 2022, slightly edging out 2021 totals. The Port recored double-digit growth over both 2020 and 2019, remaining at No. 8 after climbing two spots between 2019-2021. |
| 9 | Following a pandemic falloff in 2020, the South Florida ports experienced double-digit growth in 2021 and re-established its No. 9 position in the process. The region recorded slight growth during 2022 and volumes were nearly 4% higher than 2019 totals. |
| 10 |
Shipping cargo volumes at Port of Oakland have decreased every year since peaking in 2018, experiencing a 4.5% decrease in 2022. It is the only port that recorded lower cargo volume in 2022 when compared to 2020, and its TEUs remained 6.5% lower than the 2019 total. |
After tremendous overall growth between 2019-2023, a slowdown in cargo volume, which began in the latter part of 2022, is anticipated to continue as retailers remained flush with inventory and were not able to unload as much product during a weaker than expected holiday shopping season. However, the pause provides a much-needed loosening of pressure on the supply chain. As inflation eases, shipping volumes are projected to pick up in the back half of 2023, reversing the trend of 2022.
Longer-term, the growth of e-commerce will keep port volumes on an overall upward trajectory. However, population changes, deglobalization, and the rapidly increasing nearshoring movement will more than likely turn the trend of re-routed international shipping to the U.S. East and Gulf Coasts, which began due to congestion in the West, into a permanent shift.
Matt Dolly is Research Director for Transwestern’s Industrial Group and the firm’s Strategic Account Management program. He delivers local and national commercial real estate and economic trends, analyses and reports to team members, clients, prospects and the media.
SEE ALSO:
- Transwestern Development Co. Delivers 454,600 SF Industrial Facility in Greater Houston
- Transwestern Secures 227,300 SF Lease at New Houston Industrial Facility
- Forecasting the Future of Warehouse Demand
- South Florida’s Resilience
- Unpacking Port Congestion
RELATED TOPICS:
commercial real estate
real estate
industrial real estate
market research
market intelligence
market reports