War, what is it good for? For U.S. ports, it means higher transportation costs, longer transit times, and changes in global vessel routes and supply chain strategies.
The mid-2026 port numbers tell a bigger story than simple supply and demand. Middle East conflict, tariff uncertainty, and fresh trade-war jitters encouraged consumers and businesses to accelerate purchases ahead of potential price increases, giving a few gateways a boost before tougher year-over-year comparisons kick in.
This was not a broad-based surge across the map. Instead, the largest gateways continued to gain: four of the top five ports posted year-over-year volume increases, while the rest of the top 10 slipped into negative territory. Los Angeles and Long Beach captured a larger market share of trans-Pacific cargo because of their scale and infrastructure, while Houston benefitted from strong export activity tied to energy and industrial growth. New York/New Jersey was minimally higher. The balance of the top 10 moved lower as tougher comparisons, softer imports, tariff uncertainty and shifting cargo patterns weighed more heavily on volumes. Still, most major ports remained above 2019 levels, underscoring how much cargo flows have structurally expanded even as near-term activity has become more volatile.
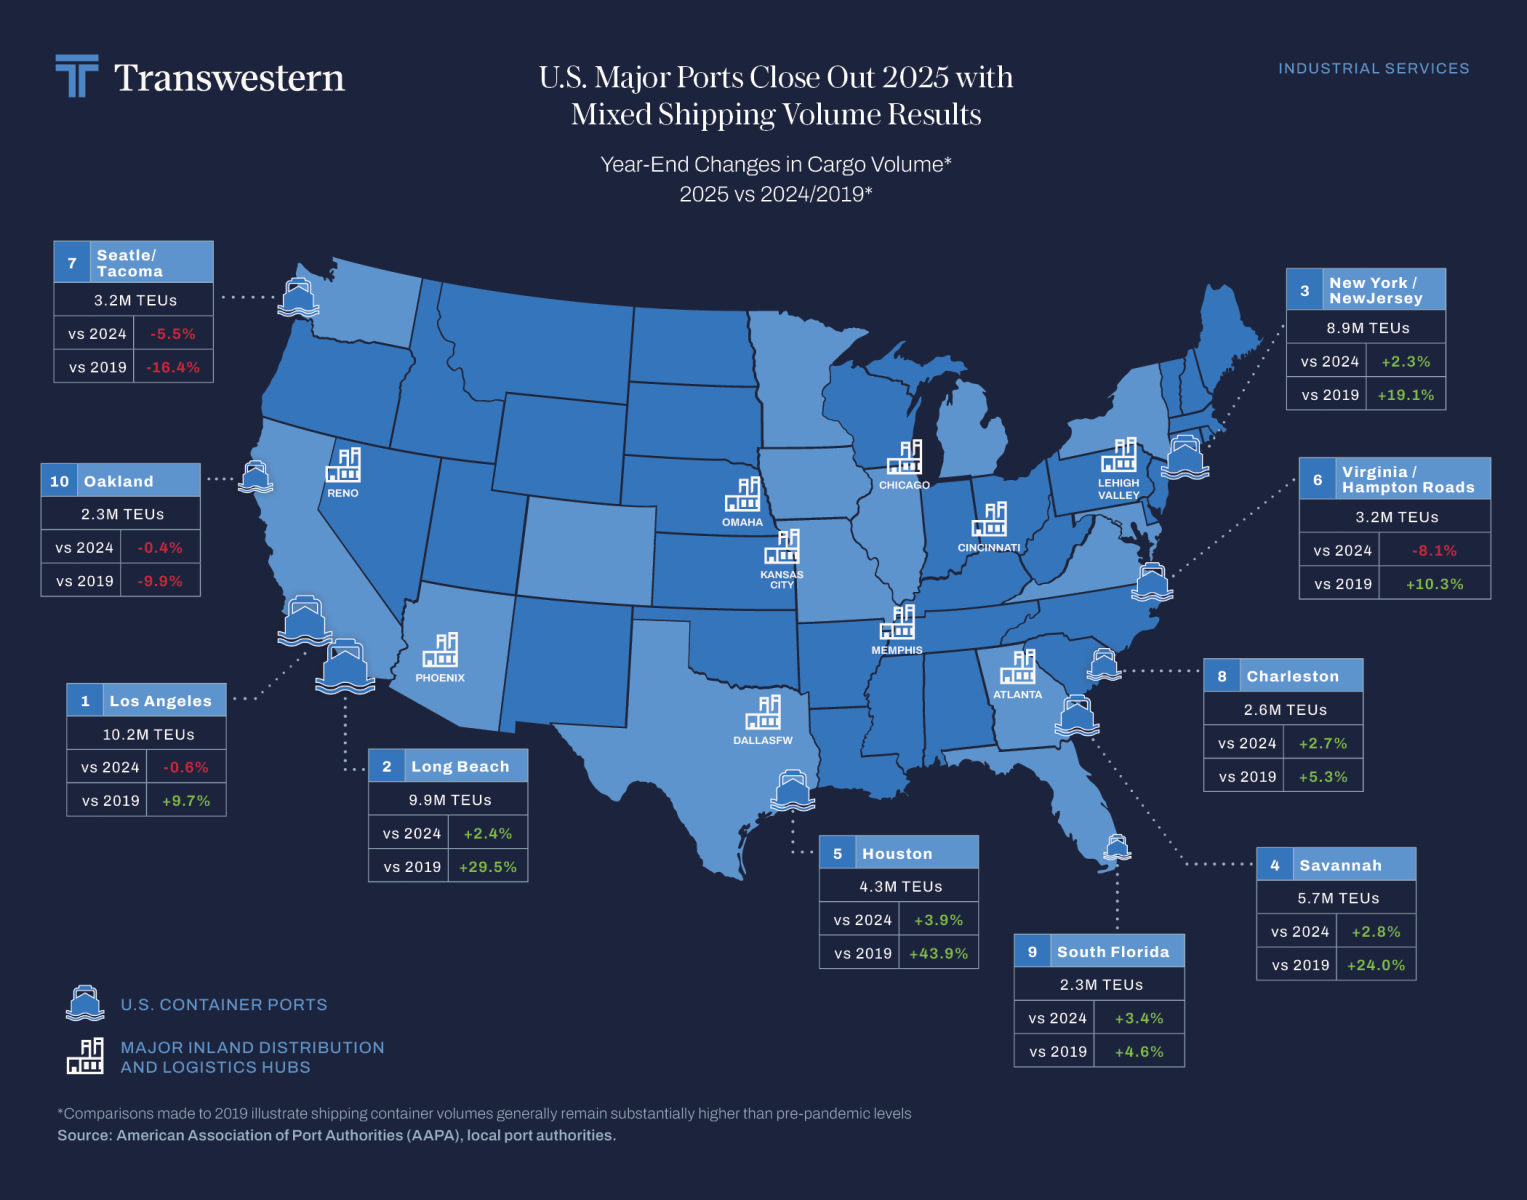
PORT HIGHLIGHTS
(Ranked by total cargo volume as of mid-year 2026)
| 1st | Mid-year activity strengthened at the Port of Los Angeles, up 3.4% from mid-2025 and 12.9% above pre-pandemic 2019 levels. The year-over-year gain was supported by gains from stronger loaded imports and early inventory movement as shippers adjusted to tariff uncertainty and retail-season planning, favoring the largest ports. |
| 2nd | Port of Long Beach volume increased 1.7% year over year, standing 31.0% above 2019 levels. Like Los Angeles, growth was helped by resilient transpacific import demand and pull-forward activity favoring Southern California ports because of their scale and ability to quickly move cargo, tied to trade-policy uncertainty, even as the pace moderated from the earlier surge. |
| 3rd | At the Port of New York and New Jersey, volumes were essentially flat year over year, rising just 0.2% through mid-2026 while remaining 21.1% above 2019. Limited growth reflects a tougher comparison to elevated 2025 activity and a more normalized flow of discretionary imports after earlier supply-chain diversions and inventory pull-forward. |
| 4th | A modest pullback at the Port of Savannah brought volumes down 0.8% from mid-2025, but they remained 26.0% above 2019 levels. The decline likely reflects normalization from an unusually strong 2025 comparison and uneven import demand as tariff uncertainty and inventory timing shifted some cargo flows. |
| 5th | Port Houston continued to expand, posting volumes 2.8% above mid-2025 levels and 52.6% higher than in 2019. Houston was also the only major U.S. port to surpass its pandemic-era 2022 peak, exceeding it by 17.5%. Growth was fueled by strong energy-related exports, expanded ship channel capacity, and sustained industrial and logistics demand, with Houston remaining the only major U.S. port where export volumes consistently outpace imports. |
| 6th | After benefiting in 2025 from diverted cargo during Baltimore’s recovery from the Francis Scott Key Bridge collapse, the Port of Virginia edged down 0.3% year over year through mid-2026. Volumes remained 12.5% above 2019, but the market faced tougher comparisons as some Baltimore-bound traffic returned following the port’s rebound. |
| 7th | The sharpest year-over-year decline occurred at the Ports of Seattle and Tacoma, where volume fell 12.4% through mid-2026 and remained 25.2% below 2019. The drop reflected weaker loaded imports, as some shippers front-loaded cargo in 2025 ahead of tariffs while others shifted volume to larger West Coast gateways. |
| 8th | Port Charleston declined 9.5% from mid-2025, reversing some of the prior year’s rebound and placing volume 1.8% below 2019. The pullback likely reflects softer import demand and uneven retailer inventory timing amid tariff uncertainty, along with a reversal of some temporary cargo shifts that supported prior-year volumes. |
| 9th | Competitive pressure from larger West Coast gateways continued to weigh on the Port of Oakland, where mid-2026 volume fell 2.5% year over year and remained 11.2% below 2019. The decline also likely reflects softer import demand and lingering weakness in export volumes following the pandemic-era cargo surge. |
| 10th | Estimated mid-year volume at the Port of Miami was down 0.9% from mid-2025 but still 7.6% above 2019. The small decline likely reflects normalization after elevated 2025 activity and uneven import flows tied to tariff uncertainty, though the port remains supported by South Florida’s consumer base and Caribbean/Latin American trade lanes. |
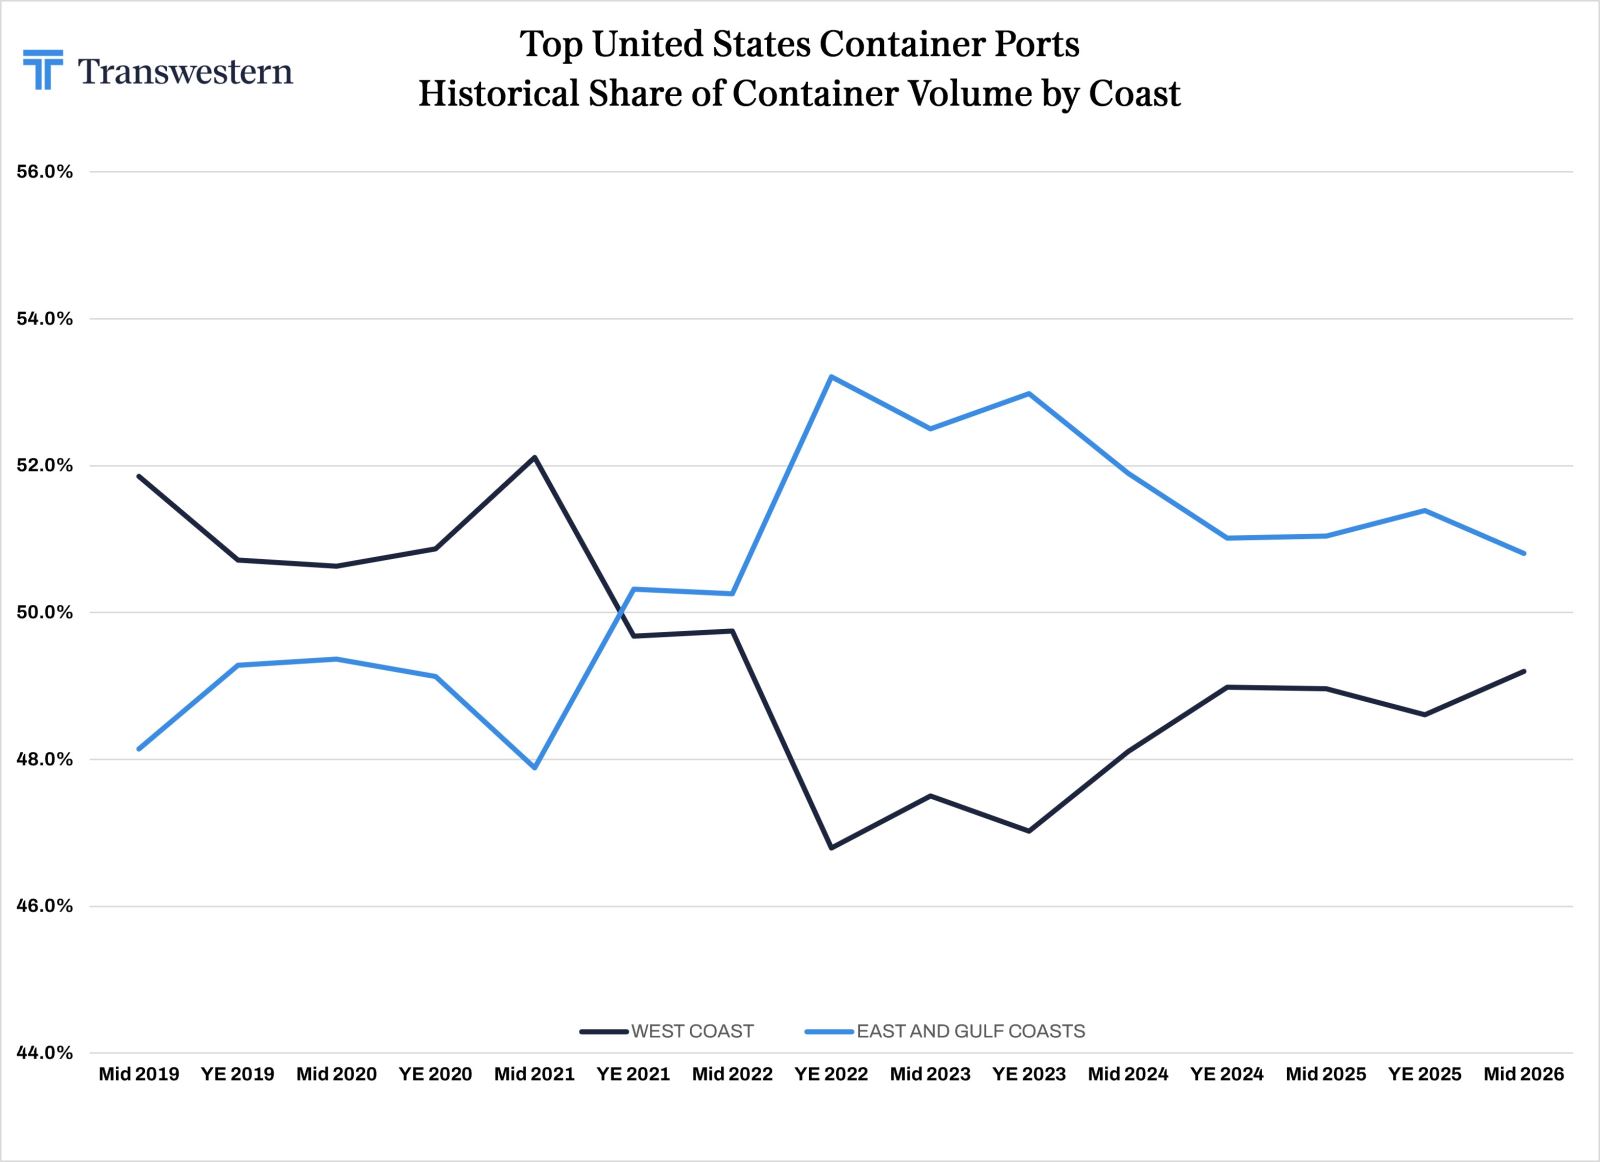
Regional performance was mixed through mid-2026: West Coast volumes were essentially flat year over year, edging up 0.2% and remaining 9.7% above 2019 levels, while East/Gulf Coast volumes declined 0.7% from mid-2025 but stayed 22.0% above 2019. The slight West Coast gain was supported by Los Angeles and Long Beach import momentum, while East/Gulf performance was held back by declines in Savannah, Virginia, Charleston and Miami despite Houston’s continued outperformance.
And the next phase of supply-chain strategy may be shaped as much by technology as by trade policy.
AI could become the next supply-chain shock absorber. By helping manufacturers forecast demand, adjust production, reroute inputs and manage inventory in real time, artificial intelligence may reduce the need to simply stockpile goods or chase the cheapest route. Cargo flows could become more strategic and flexible, but also harder to predict, favoring ports that offer speed, redundancy, strong inland connections and access to both consumers and production capacity.
Ultimately, port volumes are no longer just a measure of who moved the most boxes. They are a signal of how shippers and manufacturers are managing uncertainty in real time. After the pandemic supply-chain crunch, companies appear less willing to rely on a single route, supplier or gateway. Middle East conflict, Red Sea and Suez Canal rerouting, tariffs, fuel-cost swings and AI-enabled supply chains all point to the same conclusion: flexibility is now the premium. For industrial real estate, that favors markets with reliable cargo flows, multiple trade lanes, strong inland connectivity, modern warehouse capacity and proximity to both consumers and production nodes. In other words, a volume spike may not always mean stronger demand; sometimes, it simply reflects shippers and manufacturers trying to stay one step ahead of the next disruption.
Matt Dolly is Research Director for Transwestern’s Industrial Group and the firm’s Strategic Account Management program. He delivers local and national commercial real estate and economic trends, analyses and reports to team members, clients, prospects and the media.
SEE ALSO:
- U.S. Port Volumes Balance After Frantic Frontloading
- Import Surge Sparked by Impending Tariffs Likely to Subside
- Eye of the Industrial Market Storm
- Picture the Possibilities: Simplifying Data Analysis with GIS
- Stocked Retailer Inventories Result in First Cargo Volume Decrease Since 2020
- US Industrial Market Research Report – Q2 2026
RELATED TOPICS:
commercial real estate
industrial real estate
market reports
tenant advisory
capital markets